2040 Transportation Master Plan
Implementation


The 2040 Transportation Master Plan (TMP) is designed to guide our actions over the next 20 years. It was developed using a financial lens to ensure it is realistic, as well as with input from the public to ensure we are balancing the community’s desire for improved service levels with the need to manage costs responsibly. It also lays out ways to measure our performance as we go, to ensure we are making progress toward our vision.
This section discusses how actions recommended in the TMP can be funded. The TMP is a guide for long-term investment. Annual budget decisions that influence the funding of the TMP recommendations will be made each year by Council.
Transportation is one of the most significant items in the City budget. We currently spend an average of about $40 million each year on operating, maintaining, and expanding our transportation system. To support the 2040 OCP and work towards the Imagine Kelowna vision, it will be necessary to increase investment in our transportation system.
In Phase 3 we asked the public to weigh in on transportation investment by participating in a budget allocator exercise. On average, residents supported an increase in annual transportation funding that works out to an average annual property tax increase of about 0.2 per cent. The actions recommended in the TMP were chosen to fit within this budget, with investments gradually ramping over time, and funded primarily by increases to property taxes and development cost charges (DCCs).
Funding from the DCC Program is coordinated through the 20-Year Servicing Plan. It will be up to Council to decide on increased funding from property taxes each year as part of the annual budget.
The chart below provides a summary of the funding sources we anticipate will fund the recommendations in the Transportation Master Plan:
| Funding sources 2021-2040 | |
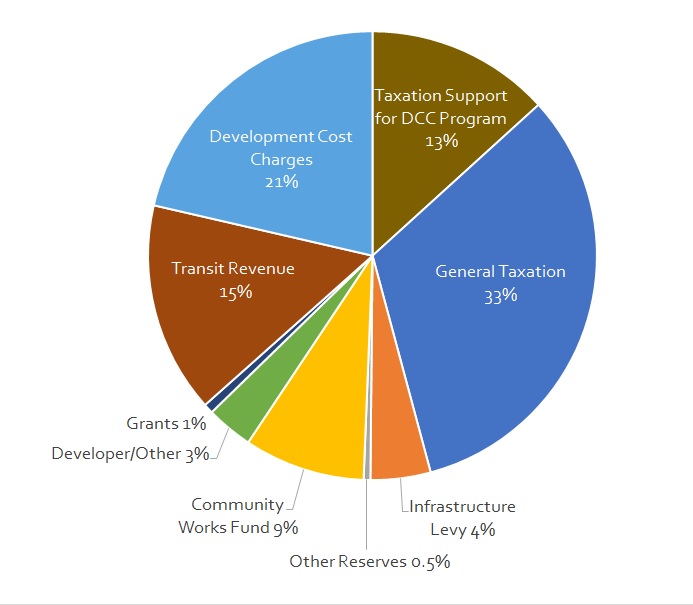 |
Property taxes – Roughly half of our transportation funding comes from property taxes. Property taxes are the most flexible source of revenue. They are often used to match or leverage funding from other sources, such as senior governments. Transit, maintenance and renewal, and education are the areas that are most dependent on taxation. A significant portion of taxation also goes towards supporting the Development Cost Charge (DCC) Program.
Development cost charges – Developers pay these fees to cover some of the City’s costs related to servicing growth with infrastructure like sewers and roads. DCCs can only be used for certain types of infrastructure, and not for operational expenses such as transit service or on-going maintenance. Together with taxation support, these funds are used for projects in the DCC Program.
Infrastructure levy – This levy was introduced in 2019 to address the backlog of infrastructure renewal projects. The levy funds projects such as road repaving, sidewalk repairs and the replacement of bridges.
Transit fare revenue – Just over half of the City's transit operating costs are recovered from fares and advertising. Transit routes with higher ridership generate more revenue, meaning they require less of a subsidy from property taxes.
Senior government grants – Funds from provincial and federal grants help us stretch our resources. Senior governments have announced major stimulus funding in response to the pandemic. The TMP puts Kelowna in a good position to take advantage of these opportunities. These funds are limited to specific uses or projects. To take advantage of grant funding opportunities, the City must have its portion of funding committed. However, we are taking a conservative approach to financial planning and are using historical averages when estimating contributions from senior governments.
Gas tax – There is a common misconception that fuel taxes pay for roadways. The federal government does return a share of fuel taxes collected in Kelowna through the Community Works Fund. However, the amount we receive only covers one-fifth of our annual spending on roads.
As electric vehicles become more common, gas tax revenues will fall. This is an international issue for governments. Future trends are likely to include charges for road usage. While no recommendations on mobility pricing are included in the TMP, the concept should be considered as a potential future opportunity.
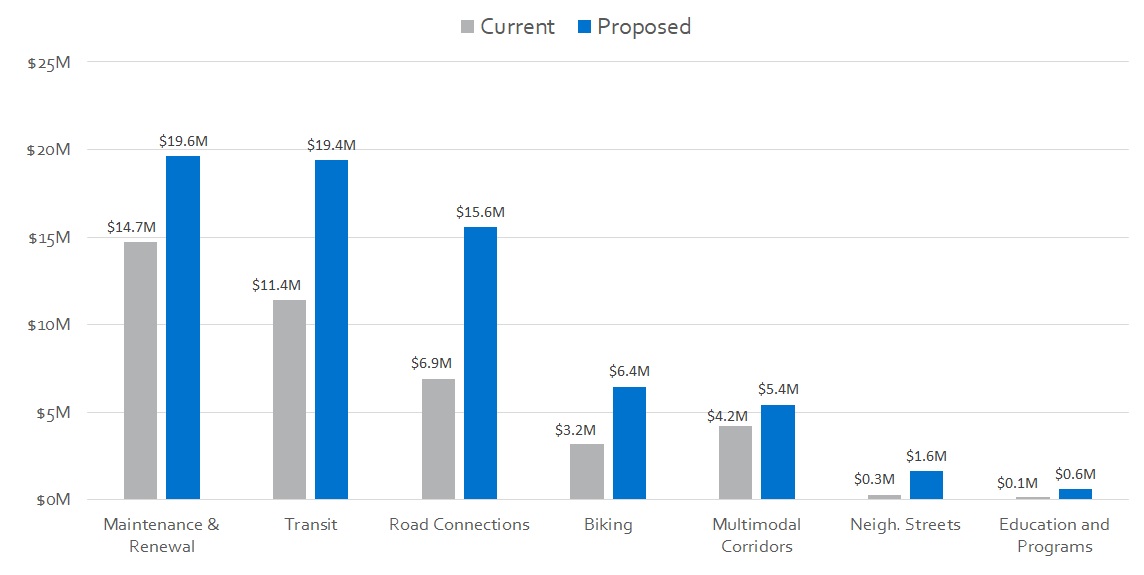
The chart below shows the investment proposed for each category and compares them to current averages. While funding increases are proposed across all categories to help keep Kelowna moving, the highest levels of investment are proposed for maintenance and renewal, and transit. This is because during our public engagement, residents told us that maintaining and renewing existing infrastructure and investing in transit are top priorities. Investing in transit is also critical for supporting the 2040 OCP and helping Kelowna grow without gridlock.
| Proposed funding by category Average annual budget 2021 to 2040 | |
 |
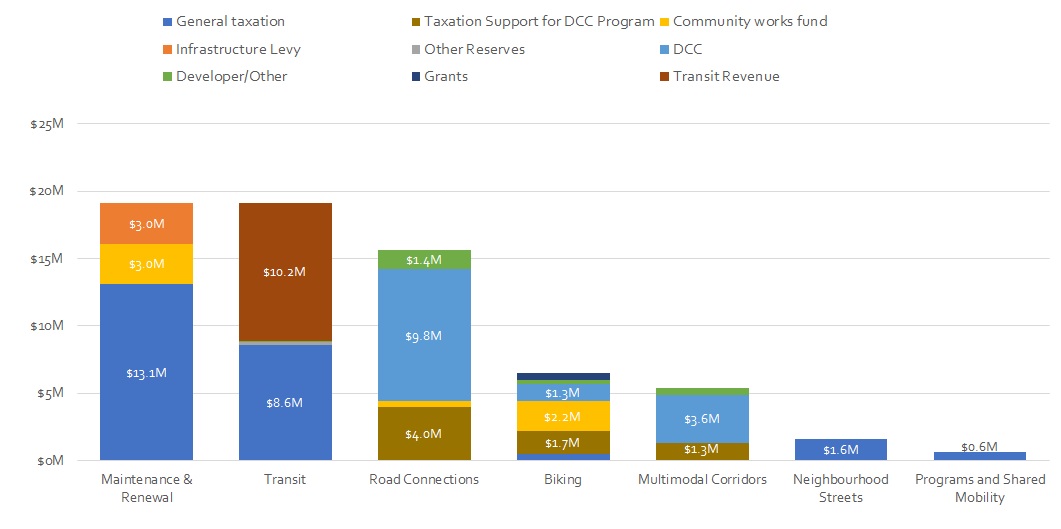
This next chart puts it all together and shows the proposed annual transportation budget in 2040. Since there are different eligibility requirements for the various funding sources, it is important to consider the funding sources for each category. The chart below highlights the different sources that are needed to fund each category of investment:
| Proposed spending by funding source | |
 |
The provincial and federal governments play major roles in funding transportation. It is estimated the TMP action list will leverage around $370 million of investment by senior governments. For example, the provincial government provides roughly half of the transit operating costs through BC Transit.
Historically, provincial and federal governments have helped pay for large transit infrastructure projects. This trend may continue and provide opportunities for transit projects such as Kelowna’s new operations facility and new exchanges. Senior governments have also funded walking and biking projects through grant programs.
Highways 97 and 33 are critical pieces of Kelowna's transportation network but both are under provincial jurisdiction. We work closely with the Ministry of Transportation and Infrastructure to maximize the movement of people and goods along both corridors. Projects that benefit provincial highways will likely be funded and delivered in partnership with the province.
It is important that we monitor our progress to make sure we keep moving toward our shared vision. The performance measures below are organized around the 12 TMP goals to reflect the many ways that transportation affects life in Kelowna. Where feasible, the TMP performance measures have been aligned with the metrics identified for the 2019 - 2022 Council priorities, to reduce duplication.
Some measures can be tracked on an annual basis, while others, such as those that rely on census or household travel survey data, can only be updated every five years. It is anticipated that staff would provide an update on the TMP performance measures annually, with a larger, more comprehensive report every five years.
Traffic related injuries and fatalities per capita
Why is this important? Traffic collisions have significant impacts on people’s lives, including property damage, injuries and fatalities. Human suffering, time off work, lost productivity, and vehicle repair costs also have big impacts on our society. ICBC data shows there are approximately 2,000 motor vehicle collisions per year that cause injuries in Kelowna. The estimated cost to society of these collisions is $500 million per year. Road safety is also an equity issue, as seniors, and people walking and biking are the ones who are most likely to be seriously injured in a collision.
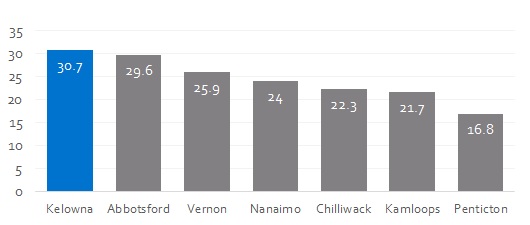
How are we doing? The number of collisions per capita is higher in Kelowna than in other similar sized B.C. cities. It is also 50 per cent higher than in Penticton and Kamloops. This is why we are taking many steps to make our streets safer and why the TMP proposes even more be done.
| Kelowna has more collisions than other BC cities Annual collisions per 100 thousand residents, 2016 | |
 |
What are we doing? Safety is an important consideration in all our projects. We are changing how we design roads to better control speeding and building more protected bike paths and safe places to cross busy roads. While we cannot prevent every injury, we can make injuries less frequent and less severe.
What’s next? We will monitor the data and work to keep this metric trending downward. The TMP recommends developing a Transportation Safety Strategy to identify key actions to help reduce the number of traffic related injuries and fatalities on our roadways. This is described further in the Targets section.
Average Commute Time
Why is this important? The time we spend commuting affects our quality of life as well as our economic competitiveness.
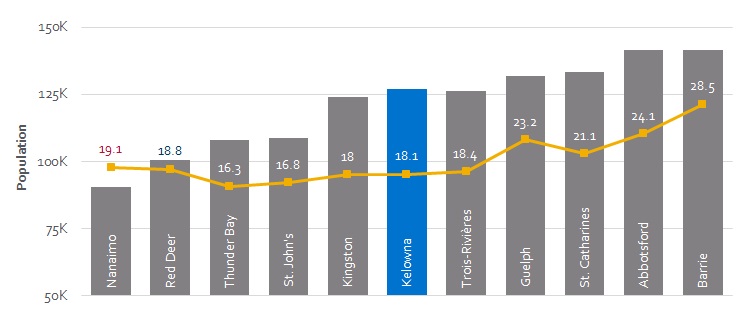
How are we doing? Average commute times in Kelowna increased from 16.2 minutes in 2007 to 18.1 minutes in 2016. Our commute times are comparable to other Canadian cities of a similar size.
| Kelowna has similar commute times to other Canadian cities Average commute time (in minutes) and population, 2016 | |
 |
What are we doing? The TMP proposes strategic roadway improvements that will help connect major employment areas such as our Urban Centres and the Gateway. This will help mitigate increasing travel times between key destinations in the city.
However, if the number of people who drive keeps growing as our population grows, it will be harder to stop commute times from rising. This is why we are also investing in options such as walking, biking, and transit, which can move more people within our existing road space. We can also shorten commutes by ensuring that a variety of housing choices are available closer to where people work.
What’s next? Average commute times tend to rise as cities grow and in conjunction with a booming economy. As described in the Forecasts and Trends Chapter, it will be important to aim for congestion levels that are not too high and not unrealistically low to keep Kelowna moving while also achieving the City’s vision and goals for transportation. This approach will ensure that the unintended negative consequences of building too much road capacity is minimized, while ensuring that investments in effective infrastructure are maximized. We will monitor changes in average commute times to ensure they remain competitive with similar cities as we grow.
Number of trips by walking, biking, and transit
Why is this important? Making it easier to walk, bike and take transit will allow more people to move around within our available space. This will help slow the growth of traffic congestion, reduce emissions, and improve public health.
How are we doing? Transit ridership was steadily increasing before the pandemic. However, in 2020, ridership decreased by 40 per cent. While the impacts of COVID-19 will likely persist for some time, we expect that ridership will eventually recover. Meanwhile, the number of bicycle trips in Kelowna increased by 40 per cent during the pandemic. We hope to build on that momentum by accelerating the expansion of our bicycle network. As for walking, it is difficult to accurately measure the number of walking trips made across the city.
What are we doing? Many of the actions recommended in the TMP focus on making walking, biking, and transit more convenient. The key is to ensure that as the city grows, we are adding new housing and new jobs in areas that are easily connected by these transportation options.
What’s next? We will monitor this metric and work to achieve the TMP’s 2040 targets of 75 per cent of trips made by vehicle, doubling transit ridership and quadrupling the number of bike trips from pre-pandemic levels (see Targets section for more information).
Investments connecting higher density urban areas
Why is this important? The 2040 OCP lays out a strategy to focus growth in our Urban Centres and Core Area. Investments that improve mobility between Urban Centres will help ensure that as our population grows, residents can still get where they need to go.
How are we doing? The City is investing in transportation options, such as biking, transit and emerging technologies to better connect Kelowna’s Urban Centres. Examples include transit infrastructure improvements, new active transportation corridors (ATCs), bicycle parking and other investments.
What are we doing? In 2020 the City invested $5 million in active transportation capital projects, including the bicycle lane and sidewalk capital programs, as well as construction of Phase 5 of the Ethel ATC (from Springfield Avenue to Rose Avenue). For transit, we invested approximately $150,000 in bus stop enhancements and transit equipment.
What’s next? We will monitor this trend to ensure investments continue to connect our Urban Centres.
Sidewalk completeness in the Core Area
Why is this important? – To minimize urban sprawl, most new housing in Kelowna will be added along existing streets in the Core Area (i.e., the flat parts of the city on the valley floor, and neighbourhoods near our Urban Centres). Many of these streets currently lack sidewalks, boulevards, or trees, but adding these features can make a street safer and more comfortable to walk, bike, and play on.
How are we doing? – The Pedestrian and Bicycle Master Plan identifies gaps on busier collector and arterial roads in the Core Area where there are no sidewalks. However, at the current level of sidewalk funding, it will take longer than a century to fill all these gaps. By that time, the sidewalks we are building today will need to be replaced.
There is also currently no strategy for updating neighbourhood streets. Developers are often responsible for adding sidewalks in front of their properties. However, relying on this means many streets will continue to have gaps, even in rapidly growing neighbourhoods.
What are we doing? – We are updating our standards for new development. The TMP recommends creating a capital program to fill in sidewalk gaps on local streets that pools contributions from citywide funds, nearby property owners and developers.
What’s next? – We will monitor this metric to ensure sidewalk completeness in the Core Area trends upward.
Trips by emerging modes (shared mobility / ride-hailing)
Why is this important? As transportation becomes more connected, automated, shared, and electric, there will be opportunities to provide Kelowna residents with more affordable and convenient options for getting around – in particular within the Core Area and Urban Centres. As transportation technologies change rapidly, it will be important to harness the benefits for our community, while being proactive to minimize any negative impacts.
How are we doing? Kelowna’s Micromobility Permit Program allows companies to rent out bikes, e-scooters, and e-mopeds. In 2019, several companies began renting e-scooters that were limited to specific off-street pathways. The permit program was paused in 2020 because of the pandemic.
In 2021, a provincial pilot program legalized the use of e-scooters throughout the city under the same rules as bikes. Several companies began renting e-scooters and more trips were made during the first two months of this program than in the previous two years of the permit program.
We are also working with the province to access data on taxi and ride-hailing services so we can measure the number of trips being made using these services.
What are we doing? Many shared mobility services rely on space along the curb for parking or passenger drop-offs. The TMP recommends developing a Curbside Management Plan to manage competing demands and get the most out of curb space. We are also working on programs to expand access to emerging technologies for lower-income residents and attract services that would otherwise not come to Kelowna. We will continue to work toward adding new mobility options that embrace technology change and give people more options for getting around.
What’s next? We will monitor this metric and work to ensure trips by emerging modes trends upwards.
Vehicles per Capita
Why is this important? Transportation is often a household’s second biggest expense. The estimated annual cost of owning a vehicle is approximately $7,000. Many households can afford to own multiple vehicles and choose to do so. However, if owning multiple vehicles is a necessity because there are no other viable options, this can increase the financial strain on medium and low-income families.
For lower-income residents, not needing to own and maintain a car to get to work can mean the difference between affording rent and facing homelessness.
How are we doing? The average number of vehicles owned by Kelowna residents fell in the past five years, from 15 per cent above the provincial average in 2016, to 5 per cent above the provincial average in 2020.
What are we doing? The development of Kelowna’s TMP was guided by Imagine Kelowna and a vision of a less car-centric city. This involves trying to encourage people and jobs to settle in areas of the city where car ownership is more optional.
What’s next? We will monitor this metric and work toward a downward trend.
| The number of vehicles per person has decreased since 2016 Number of vehicles per person (excluding trailers and commercial vehicles) | |
|
Share of Students Driven to School
Why is this important? – Increasing the share of students walking, biking, or busing to school will benefit public health, congestion, and emissions. Children who walk or bike to school are more active overall than children who get to school by car.
How are we doing? – On a typical day, about half of Kelowna’s K-12 students are driven to school. Around half of the adults who drive kids to school continue on to work, while the other half drive back home. These trips between school and home have a big impact on congestion and emissions.
What are we doing? – We are increasing the funding for the Safe Routes to School Program to reach all schools in Kelowna over the next 10 – 15 years. There is also added funding to offer more bike skills training to elementary school students and we are prioritizing the construction of new sidewalks, bike paths, and crosswalks near schools.
Where people decide to live and where new schools are built will also influence how students get to school. Kids in suburban or rural areas often must travel long distances to get to school, making it more challenging to walk or bike. School busing will be the better option to reduce vehicle trips in these areas. And the more successful we are at attracting families to live in the Core Area, the more successful we will be at reducing the share of students driven to school.
What’s next? – We will monitor this trend and work to keep it trending downward.
Share of low-income residents close to frequent transit
Why is this important? For lower-income residents, not needing to own and maintain a car to get to work can mean the difference between affording groceries and having to use the food bank. Alternatives such as taking the bus or biking give residents access to employment and opportunities in the larger economy.
How are we doing? Roughly half of low-income residents are within a five-minute walk of frequent transit service today. This metric uses actual walking distances to bus stops and considers places where it is safe to cross major roads. The low-income line is defined using Statistics Canada’s measure of after-tax household income from the 2016 Census.
What are we doing? –The TMP proposes a 65 per cent increase in transit service over the next 20 years. Most of this new service will be focused on popular routes in the Core Area, where most of our low-income residents live.
What’s next? – Based on the service increases proposed in the TMP, we anticipate the share of low-income residents close to frequent transit could rise from 50 per cent to 70 per cent by 2040. We will monitor this metric and work to keep it trending upward.
Share of low-income residents close to primary bike routes
Why is this important? For lower-income residents, not needing to own and maintain a car to get to work can mean the difference between affording groceries and having to use the food bank. Alternatives such as taking the bus or biking give residents access to employment and opportunities in the larger economy.
How are we doing? Today roughly 22 per cent of low-income residents live within 400 metres of a primary bicycle route.
What are we doing? The TMP includes many recommendations for improved active transportation facilities and connections. Many of these projects are in the Core Area where most of our low-income residents live. In addition, we are working to speed up progress on the bicycle network by using quick-build projects and designs which do not require us to fully tear up and reconstruct a street.
What’s next? Based on the biking projects prioritized in the TMP, we anticipate the share of low-income residents close to the primary bike network could rise from 22 per cent to 75 per cent by 2040. We will monitor this metric and work to keep it trending upward.
Key corridor vehicle travel times
Why is this important? – Reliable travel times help people get where they need to go on time.
How are we doing? – We use online data to track travel times along sample routes across the City. This data allows us to see how travel times on these routes vary throughout the day and year, as well as how they change over time. A summary of current and projected key corridor travel times is available in the TMP Scenarios Report (see page 11).
What are we doing? – Many of the recommended actions in the TMP will increase the efficiency of our road network, such as improving signal timing (i.e., better coordinate traffic lights along a route so traffic flows smoothly), building new road connections, and expanding intersections.
In addition to targeted investments in road capacity, the best way to keep travel times from increasing as our population grows will be to give people more options besides driving. This will reserve road space for those trips that absolutely need to be made by car.
What’s next? – As described in the Forecasts and Trends Chapter, it will be important to aim for congestion levels that are not too high and not unrealistically low to keep Kelowna moving while achieving the City’s vision and goals for transportation. This approach will ensure that the unintended negative consequences of building too much road capacity are minimized, while ensuring that investments in effective infrastructure are maximized. We will work to collect data and monitor travel times to ensure this balance is maintained.
Transportation emissions
Why is this important? – Transportation is the largest source of greenhouse gas emissions in Kelowna. Scientists warn that emissions need to be cut in half over the next decade to avoid catastrophic impacts from climate change.
How are we doing? – Measured by the amount of fuel sold in Kelowna, transportation emissions fell by 9 per cent in 2020. The pandemic likely influenced this trend as people stayed home more and travelled less.
| Fuel sales have decreased since 2017 Trend in fuel sales in Kelowna by year, compared to 2007 baseline | |
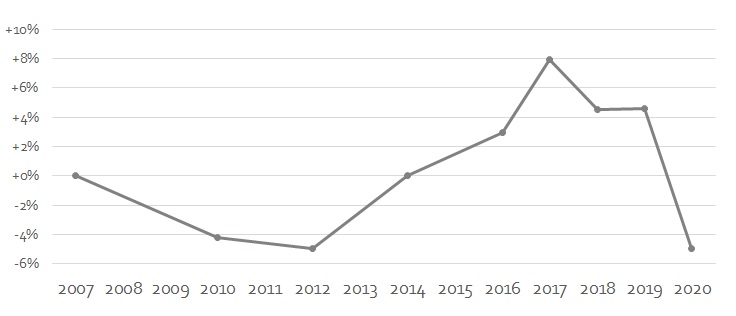 |
Fuel sales do not capture all transportation emissions, notably the emissions from manufacturing vehicles or building infrastructure such as roads. Kelowna’s fuel sales also include fuel purchased by people who live in other cities and by tourists. Still, fuel sales are one of the most direct ways we have for tracking transportation-related emissions.
What are we doing? – The TMP includes several recommendations for speeding up the adoption of electric vehicles, such as electrifying public transit and ride-hailing fleets. The Community Electric Vehicle and E-Bike Strategy provides more recommendations for moving to electric vehicles.
However, electric vehicles cannot be our only response to climate change as it will take some time before the majority of vehicles on the road are electric. We also need to consider the emissions from manufacturing vehicles and building new roads. This is why working to increase the share of trips made in Kelowna by walking, biking and transit is also critical to reducing emissions.
Additionally, we are working to find more precise ways of estimating our transportation emissions beyond just measuring fuel sales.
What’s next? – Based on actions recommended in the TMP, we are working to reduce the average distance driven per person by 20 per cent. This is described further in the Targets section. While this reduction in average distance driven per person is expected to reduce per capita emissions, the degree of reduction to our absolute transportation emissions will be influenced by a number of factors including population growth, total distance driven, changes in vehicle fuel efficiency, and the uptake of electric vehicles. A reduction in absolute emissions is required to make progress toward the targets in Kelowna’s Community Climate Action Plan.
The Transportation Master Plan sets out a long-term vision for changing how Kelowna residents get around. However, it is important to set realistic expectations for how much can change in 20 years.
The targets below were developed through detailed modelling and analysis. They are intended to be ambitious, yet achievable with the actions proposed in the TMP. The targets are based on key metrics that help us understand broad trends in travel behaviour and provide a snapshot of the direction Kelowna is heading.
Mode share is a term for the portion of trips that happen by different means of travel. Mode share changes slowly. Current travel patterns in Kelowna are the result of decades of land use and infrastructure decisions, economic forces, and societal trends that reinforce each other.
Kelowna residents currently make 85 per cent of their trips by vehicle, either as a driver or a passenger. The remaining 15 per cent of trips are made by other means (e.g. biking, walking, transit) and comprise our sustainable mode share.
We are working toward a target of 79 per cent of trips made by vehicle (21 per cent by sustainable modes) by 2030, and 75 per cent of trips made by vehicle (25 per cent by sustainable modes) by 2040.
This is a conservative estimate that considers population growth, demographic trends, and actions recommended in the TMP. Reaching this target will mean doubling transit ridership and quadrupling the number of bike trips made by Kelowna residents.
The CleanBC Roadmap proposes to move sustainable mode share from 24 per cent to 30 per cent by 2030 (i.e. a 6 percentage point increase). This target is a provincial average, and different regions will have different opportunities to shift modes. While it is not possible to match the provincial average of 30 per cent by 2030, the TMP aligns with the CleanBC 2030 mode share target by matching the 80 increase in sustainable mode share of 6 percentage points. This means Kelowna would move from 15 per cent to 21 per cent and will be doing our part to improve the provincial average.
Aligning with CleanBC’s 2040 target of 40 per cent in the same way would require Kelowna to increase sustainable mode share by 16 percentage points. We estimate the TMP could achieve a 10 percentage point increase citywide, from 15 per cent to 25 per cent. While further work is needed to align with the 2040 provincial mode share target on a citywide basis, some parts of the city will be able to surpass it. For example, in the area comprised of Downtown, Pandosy, and Landmark sustainable mode share is projected to increase by 20 percentage points (from 25 to 45 per cent by 2040). This speaks to the importance of focusing growth in our Core Area to help shorten trip distances and make it easier for people to get around using sustainable modes of travel.
The table below shows the existing mode share for driving by neighbourhood and what we think can be achieved by 2040:
| Current (2018) | 2040 Target | |
| Citywide | 85% | 75% |
| Downtown/Pandosy/Landmark | 75% | 55% |
| Midtown | 80% | 70% |
| Rutland | 85% | 75% |
| Glenmore | 90% | 85% |
| The Mission/Southeast Kelowna | 90% | 90% |
| North Kelowna | 90% | 90% |
| Black Mountain | 95% | 95% |
The total distance driven (also referred to as vehicle kilometres travelled) is a better measure for congestion and emissions than mode share. This is because mode share does not consider the length of a trip, so it does not distinguish between driving a few blocks or all the way across town.
Our population is expected to grow by approximately 40 per cent. Based on the 2040 OCP, total distance driven is anticipated to increase by 25 per cent (if we make no additional investments in transportation). We can reduce the average distance driven per person by locating growth closer to jobs and destinations and providing more transportation options.
Based on the actions recommended in the TMP, we are working to reduce the average distance driven per person by 20 per cent. This would keep the increase in total distance driven to approximately 10 per cent.
While not costed for in this plan, there are additional measures that can be taken to reduce VKT in Kelowna from 10 per cent to 5 per cent growth. These actions are described as options in the Recommended Actions Chapter (see Project IDs 15, 18, 20, and 24) and position the City to be ready should there be investments from senior governments to achieve these goals.
The CleanBC Roadmap proposes a 25 per cent province-wide reduction in total distance travelled by light-duty vehicles by 2030. Some parts of the province may be better able to meet this target than others. While reducing the total distance driven is desirable, the reality is that it is extremely challenging in the face of population growth. All future trips would need to be accommodated by other modes besides driving. This is not yet realistic given Kelowna’s current layout and continued growth in neighbourhoods that depend on cars.
It should also be noted that the 20 per cent reduction in driving per capita is meant to be an average. Some people will have more opportunities to drive less than others, depending on where they live, their occupation, their family commitments, and their physical ability.
Injuries and fatalities resulting from traffic collisions have a devastating impact on the people involved and on the community. The TMP aims to reduce the number of injuries and deaths on our roads through targeted interventions such as the proposed Road Safety Program and traffic safety audits when designing major capital projects.
The TMP recommends developing a Transportation Safety Strategy to set specific targets and outline the actions necessary to reduce injuries and fatalities on our roadways.